Blog / 28 Jul 2026
500 out of 500: We Completed the FinRetrieval Benchmark
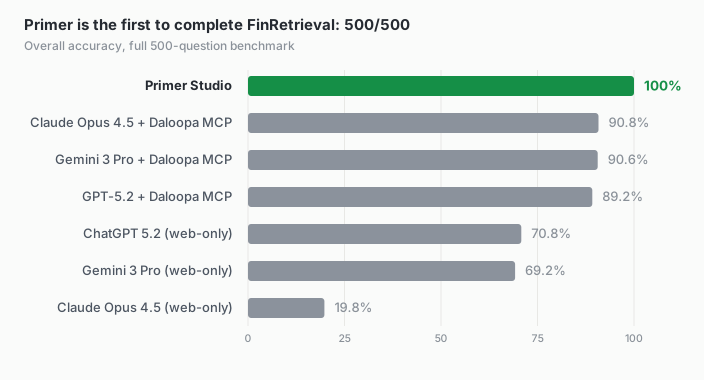
Earlier this year we shared our results on the UK, US and EU portion of Daloopa’s FinRetrieval benchmark. We’ve now run the whole thing: all 500 questions, every region, and got all of them right. Getting there taught us more about benchmarks than it did about AI.
Running the full 500
FinRetrieval is 500 questions pulled from real company filings: find the exact number, in the right period, in the right unit. Our first pass covered the UK, US and EU companies, because that’s where our document library was already deep.
The rest of the benchmark is where it gets hard. The other 216 questions cover companies in China, Japan, Brazil, Australia and beyond. That means filings in different languages, different accounting conventions, different fiscal calendars, often published as PDFs that were never designed to be read by a machine. We spent the intervening months getting those documents ingested and processed properly.
The result: 500 out of 500. Same scoring standard as the published benchmark, no exclusions, no asterisks.
What that number is really telling you
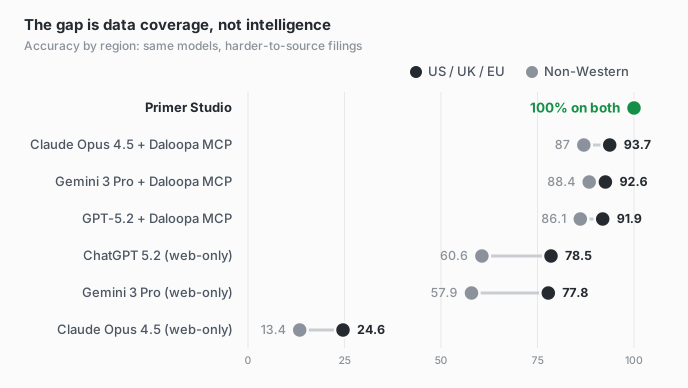
The best publicly released FinRetrieval configuration, a frontier model wired up to Daloopa’s own retrieval tools, gets about 90.8% overall. But look at the split: 93.7% on US/UK/EU questions and 87.0% everywhere else. The same model gets noticeably worse the moment the filings get harder to source and parse.
That gap matches our experience exactly. Every single failure we debugged on the way to 100% turned out to be a data problem: a document we hadn’t ingested, a table that parsed badly, a period mapped to the wrong fiscal calendar. Not once was the fix “use a smarter model.”
That’s worth sitting with, because it changes what this benchmark measures. FinRetrieval used to look like a test of AI capability. At this point it’s a test of data infrastructure. The intelligence was never the bottleneck; the plumbing was.
There’s a practical lesson in that for anyone building with agents. If your data isn’t set up in an AI-native way, the agent won’t perform, no matter how good the model is. Plugging a frontier model into a database that was designed for humans, or for traditional software, doesn’t work. Agents need to be able to parse the data, trace where it came from, and understand how it fits together: which filing, which period, which unit, how one number relates to another. That’s not something you bolt on afterwards. It has to be how the data layer is built from the start, and our score on this benchmark is downstream of years of building exactly that.
The 11 questions where the benchmark was wrong
Checking 500 answers against primary filings has a side effect: you also end up checking the benchmark. In 11 cases, we concluded the official answer was the wrong one. The filing simply says something different.
The mistakes follow familiar patterns: a number extracted incorrectly, a value pulled from the wrong period or document, a currency mislabelled, guidance that had since been updated, or two similar-sounding metrics confused for each other. A few examples (question numbers refer to the benchmark’s own index; the full list is in the appendix below):
Question 48, Planet Labs
The question asks what next-year adjusted EBITDA guidance was given at the calendar Q2 2021 earnings announcement. As far as we can tell, no such guidance was given at that announcement; the figure the benchmark expects comes from a later disclosure.
Question 8, Ferguson
The question asks for the answer in pounds, but Ferguson had redomiciled and the filing reports the tax adjustment in dollars. Our agent followed the filing.
Question 136, Winnebago
The filing reports dealer inventory by segment, 16,744 Towable and 4,068 Motorhome, which sum to 20,812 units. The benchmark’s own answer text agrees at 20,812. Its scored answer key says 20,182. Two digits got swapped somewhere.
Question 71, Weimob
The filing reports the figure in RMB thousands; the benchmark labels the same number as Hong Kong dollars.
None of this is a knock on Daloopa. Label errors are inevitable in any hand-built benchmark, and finding them is the point of publishing one: different teams run the same test, argue about the disagreements with the source documents open, and the labels get better. That process only works in the open. In that spirit, the appendix below walks through all 11.
So what do we measure now?
We want to be careful about what 100% means. It doesn’t mean the system is perfect. It means this particular test can no longer tell strong systems apart, and that’s a signal to change the test.
We still run FinRetrieval constantly, but as a smoke alarm rather than a scoreboard. If the score ever dips, something broke in ingestion or retrieval, and we go find it. As a measure of whether an agent can actually do an analyst’s job, though, looking up a number is table stakes.
The real questions are the ones an analyst faces every day. What do you do when two documents disagree? Can you build a forecast and show your assumptions? Can you trace how guidance shifted quarter by quarter, and say “the data isn’t there” when it isn’t? That’s what separates a data store from an analyst, and it’s where we’re pointing our benchmarking effort next.
Appendix: the 11 disputed questions in detail
Question numbers are the benchmark’s own index values, so anyone with the published parquet can check our working. For each one: what was asked, what the benchmark expects, and what the primary filing actually says.
Question 8 — Ferguson plc (FERG:LN), 2025 H1, operational KPIs
Asked: Ferguson’s discrete tax items adjustment within income from continuing operations for fiscal 2025 H1, in GBP millions.
Benchmark answer: −£8 million.
What the filing says: Ferguson redomiciled and reports in US dollars. The fiscal 2025 H1 results report the discrete tax items adjustment as −$8 million. The magnitude matches, but the currency in the question and answer key doesn’t match the filing.
Question 48 — Planet Labs PBC (PL), guidance given at calendar Q2 2021, guidance/outlook
Asked: what adjusted EBITDA guidance for the next full calendar year Planet gave at its calendar Q2 2021 earnings announcement.
Benchmark answer: −$39 million.
What the filing says: we could not find that guidance in the calendar Q2 2021 announcement materials at all. The nearest disclosure is from a later announcement, where Planet guided to a range of −$41 to −$39 million. Complicating matters, Planet’s fiscal year ends January 31, so its fiscal quarters sit awkwardly against the calendar quarters the question uses.
Question 71 — Weimob Inc (2013:HK), calendar Q2 2019, balance sheet
Asked: Weimob’s non-controlling interests balance at calendar Q2 2019, in HKD thousands.
Benchmark answer: −2,037 thousand HKD.
What the filing says: the interim filing’s balance sheet is presented in RMB’000, not HKD. The −2,037 figure is right, the currency label isn’t.
Question 136 — Winnebago Industries (WGO), fiscal Q4 2023, operational KPIs
Asked: Winnebago’s RV dealer inventory in units at the end of fiscal Q4 2023.
Benchmark answer: 20,182 units.
What the filing says: the Q4 2023 earnings release reports dealer inventory by segment: 16,744 Towable units and 4,068 Motorhome units, summing to 20,812. The benchmark’s own written answer says 20,812 and links a source supporting it; only the scored value key says 20,182. Two digits got transposed.
Question 292 — M3, Inc. (2413-JP), fiscal year 2022, cash flow
Asked: M3’s net cash used in financing activities for fiscal year 2022, in JPY millions.
Benchmark answer: −22,837 million.
What the filing says: the consolidated cash flow statement in the FY2022 filing (dated April 27, 2022) reports −16,371 million JPY, and −22,837 appears nowhere in that document. It does appear in M3’s accounts, though: it is the figure for the following fiscal year, ended March 31, 2023, whose filing shows −16,371 as the prior-year comparative. The benchmark’s answer is the right line item from the wrong year.
Question 306 — Embraer S.A. (EMBR3:BZ), calendar Q3 2022, guidance/outlook
Asked: the low end of Embraer’s full-year 2022 adjusted free cash flow outlook at the Q3 2022 earnings announcement.
Benchmark answer: $50 million.
What the filing says: the Q3 2022 earnings materials state that guidance was raised from “US$50 million or better” to “US$150 million or better”. At the announcement the question asks about, the low end was $150 million. The benchmark kept the stale, superseded figure.
Question 332 — Buzzi S.p.A. (BIT:BZU), fiscal H1 2015, segments and geography
Asked: Buzzi’s capital expenditures in Luxembourg for fiscal H1 2015, in EUR millions.
Benchmark answer: €36 million.
What the filing says: €3.6 million. The half-year report’s geography table is denominated in millions of euros and, being an Italian document, writes the figure as “3,6” with a decimal comma. Read with an English decimal point, that becomes 36, and the benchmark value is inflated tenfold.
Question 372 — Spirax-Sarco Engineering (LSE:SPX), calendar Q4 2016, operational KPIs
Asked: how many product lines the company reported “according to its 2016 Annual Report”.
Benchmark answer: 3,500.
What the filing says: the “3,500+ product lines” figure is real, but it appears in the Half Year Report 2016 (in the Watson-Marlow section of the “About us” pages), not the 2016 Annual Report the question cites. In the Annual Report, 3,500 appears only in share-plan tables. The value is right and the cited source is wrong, which matters for a benchmark that tests retrieval against specific documents.
Question 402 — EVT Limited (EVT:AU), fiscal year ended 30 June 2020, income statement
Asked: EVT’s diluted earnings per share from continuing operations for the fiscal year ended 30 June 2020, in cents.
Benchmark answer: −22.4 cents.
What the filing says: this one is a restatement problem. EVT’s original FY2020 report did show −22.4 cents, but the company later reclassified its German entertainment business from discontinued to continuing operations, and the FY2021 results restated the FY2020 comparative to −35.4 cents. The source document the benchmark links is the FY2021 results, where the continuing-operations figure for FY2020 is −35.4 and −22.4 does not appear on that basis. An agent reading the cited source cannot produce the benchmark’s answer.
Question 455 — Stem, Inc. (STEM), fiscal Q2 2024, income statement
Asked: Stem’s basic net loss per share attributable to common stockholders for fiscal Q2 2024, in USD.
Benchmark answer: −$71.81.
What the filing says: the Q2 2024 10-Q reports $(3.59). Stem later executed a 1-for-20 reverse stock split (effective June 2025), and −$3.59 × 20 is −$71.80: the benchmark answer is the retroactively split-adjusted figure, not the per-share number the filing reports for that quarter. −$71.81 does not appear in the cited source.
Question 486 — Bakkt Holdings (BKKT), calendar year 2021, operational KPIs
Asked: how many employees Bakkt had across its four main locations for full-year 2021.
Benchmark answer: 600.
What the filing says: the FY2021 10-K’s Human Capital section states 765 employees across its four core locations as of December 28, 2021.